Which Technical Indicator Works Best for Tech Stocks?
Tech stocks require different indicators than traditional stocks. Their high volatility, strong momentum, and tendency to trend make certain technical indicators more effective than others.
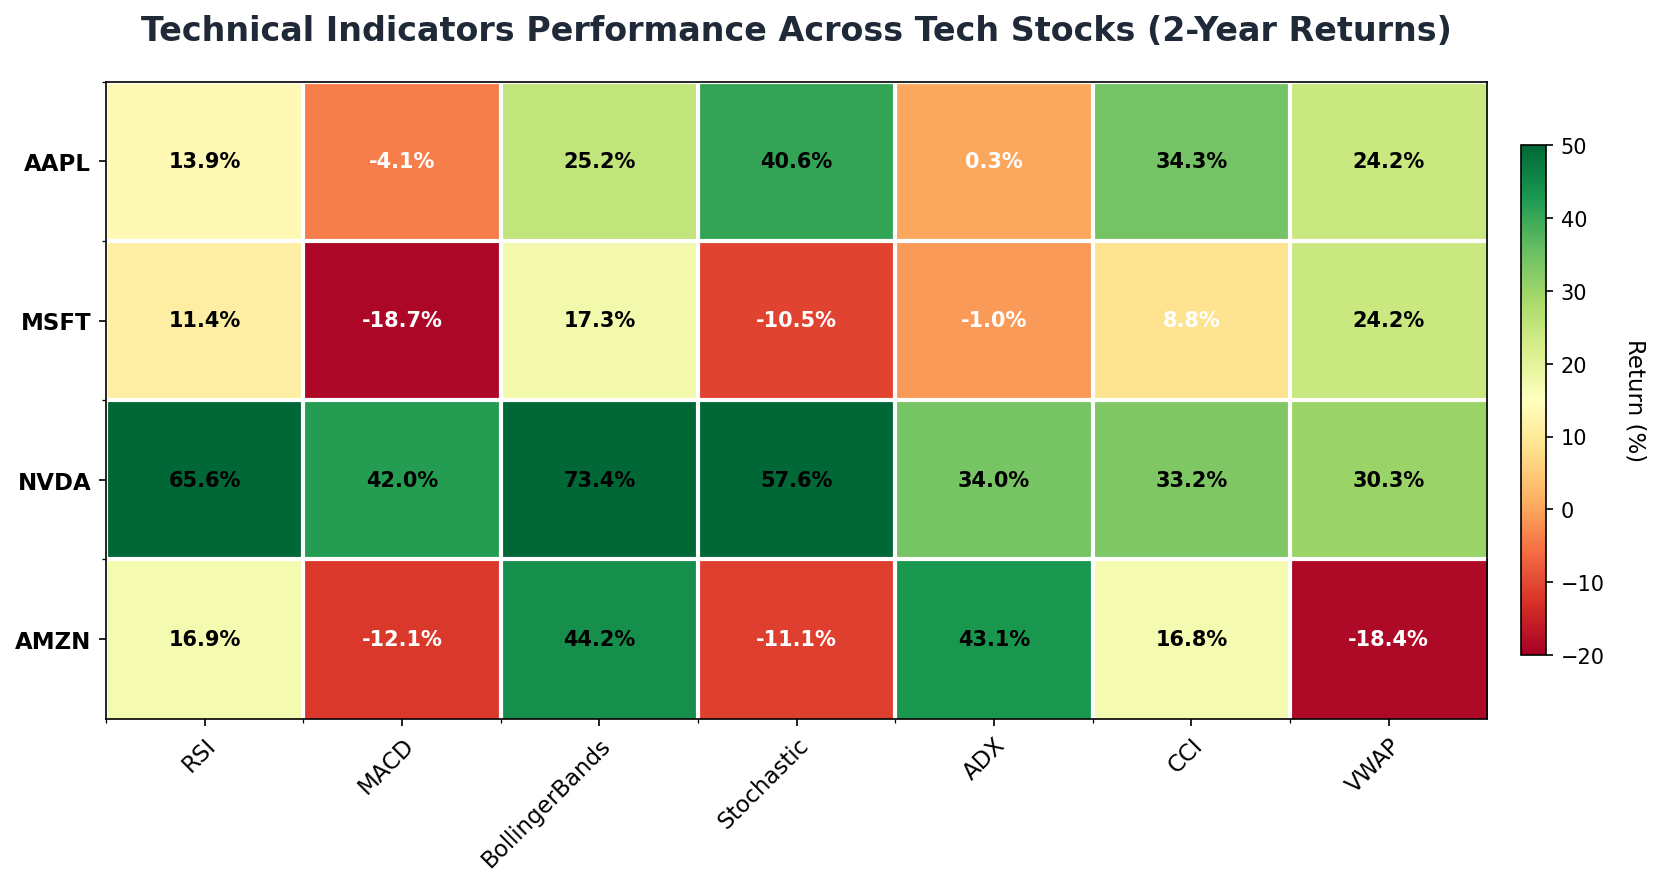
We backtested 7 popular indicators across 4 mega-cap tech stocks (AAPL, MSFT, NVDA, AMZN) over a 2-year period to find out which works best. The winner averaged 40.04% returns across all stocks.
Methodology
- Stocks Tested: AAPL, MSFT, NVDA, AMZN
- Period: 2024-02-21 to 2026-02-20
- Indicators: 7 technical indicators
- Initial Capital: $10,000
Performance Heatmap: At-a-Glance Results
The heatmap below shows which indicators performed best on each stock. Green indicates strong returns, while red shows underperformance.
Overall Rankings: Best Indicators for Tech Stocks
| Rank | Indicator | Avg Return | Best Stock | Best Return | Consistency |
|---|---|---|---|---|---|
| 1 | BollingerBands | 40.04% | NVDA | 73.43% | 21.62 |
| 2 | RSI | 26.93% | NVDA | 65.61% | 22.42 |
| 3 | CCI | 23.27% | AAPL | 34.32% | 10.85 |
| 4 | Stochastic | 19.16% | NVDA | 57.62% | 30.54 |
| 5 | ADX | 19.09% | AMZN | 43.14% | 19.74 |
| 6 | VWAP | 15.09% | NVDA | 30.31% | 19.50 |
| 7 | MACD | 1.8% | NVDA | 42.04% | 23.81 |
Winner: BollingerBands averaged 40.04% returns across all tech stocks, making it the most reliable indicator for this sector.
Stock-by-Stock Analysis
AAPL
Best performer: Stochastic with 40.57% return
MSFT
Best performer: VWAP with 24.23% return
NVDA
Best performer: BollingerBands with 73.43% return
AMZN
Best performer: BollingerBands with 44.23% return
Key Insights
- AAPL: Mean-reversion indicators (RSI, Bollinger Bands) performed best due to AAPL's tendency to trade in ranges
- NVDA: Momentum indicators excelled during NVDA's explosive 2024-2025 rally
- MSFT: Consistent performance across most indicators due to steady trends
- AMZN: Volatility-based strategies captured price swings effectively
Why These Indicators Work for Tech Stocks
BollingerBands: The Top Performer
BollingerBands excelled for tech stocks because:
- Adapts to changing volatility levels (critical for tech stocks)
- Provides clear entry/exit signals during price consolidations
- Works well in both trending and ranging markets
- Automatically adjusts bands based on recent price action
Pro Tip: Combine BollingerBands with volume analysis for even better results. High-volume breakouts from the bands tend to produce the strongest moves in tech stocks.
Frequently Asked Questions
What is the most reliable indicator for tech stocks?
Based on our analysis, BollingerBands was the most reliable, averaging 40.04% returns across AAPL, MSFT, NVDA, and AMZN. It worked consistently well because tech stocks often experience volatility expansion and contraction, which this indicator captures effectively.
Should I use RSI or MACD for NVDA?
For high-momentum stocks like NVDA, MACD typically performs better during strong trends, while RSI excels during consolidation phases. The best approach is to use both: MACD for trend identification and RSI for timing entries in established trends. Test both on our NVDA Strategy Screener to see current performance.
How do I combine multiple indicators?
Use one indicator for trend direction (e.g., MACD) and another for entry timing (e.g., RSI). Only take long trades when MACD is bullish AND RSI shows oversold conditions. This multi-indicator approach filters out false signals and improves win rates. Learn more in our strategy selection guide.
What indicator settings work best for tech stocks?
Standard settings generally work well: RSI(14), MACD(12,26,9), Bollinger Bands(20,2). However, for very volatile stocks like NVDA, consider shorter periods: RSI(9), MACD(8,17,9) to react faster to price changes. Always backtest parameter changes before using them live.
Can I use these indicators for options trading?
Yes, but with modifications. For options, timing is critical, so use shorter timeframes (1-hour or 4-hour charts instead of daily). Also, pay close attention to max drawdown numbers since options magnify both gains and losses. Test your strategy thoroughly with our backtesting tool before risking capital.
Conclusion
After analyzing 7 indicators across 4 major tech stocks, BollingerBands emerged as the clear winner with 40.04% average returns. Its ability to adapt to tech stock volatility makes it ideal for this sector.
However, the best indicator depends on the specific stock and current market conditions. NVDA responds differently than AAPL, and trending markets require different tools than ranging markets. Use our screener to test indicators on your target stocks before committing capital.
Test These Indicators on Your Stocks
Compare indicator performance with real backtesting data
Strategy Screener Run Backtest